
These were all done last year for my Sketching Ideas class. Though named weirdly the course was pretty informative on how to represent information in different ways.
8-Bit Toronto
This was done to show Toronto in new ways. As I like video games I chose this retro feel.

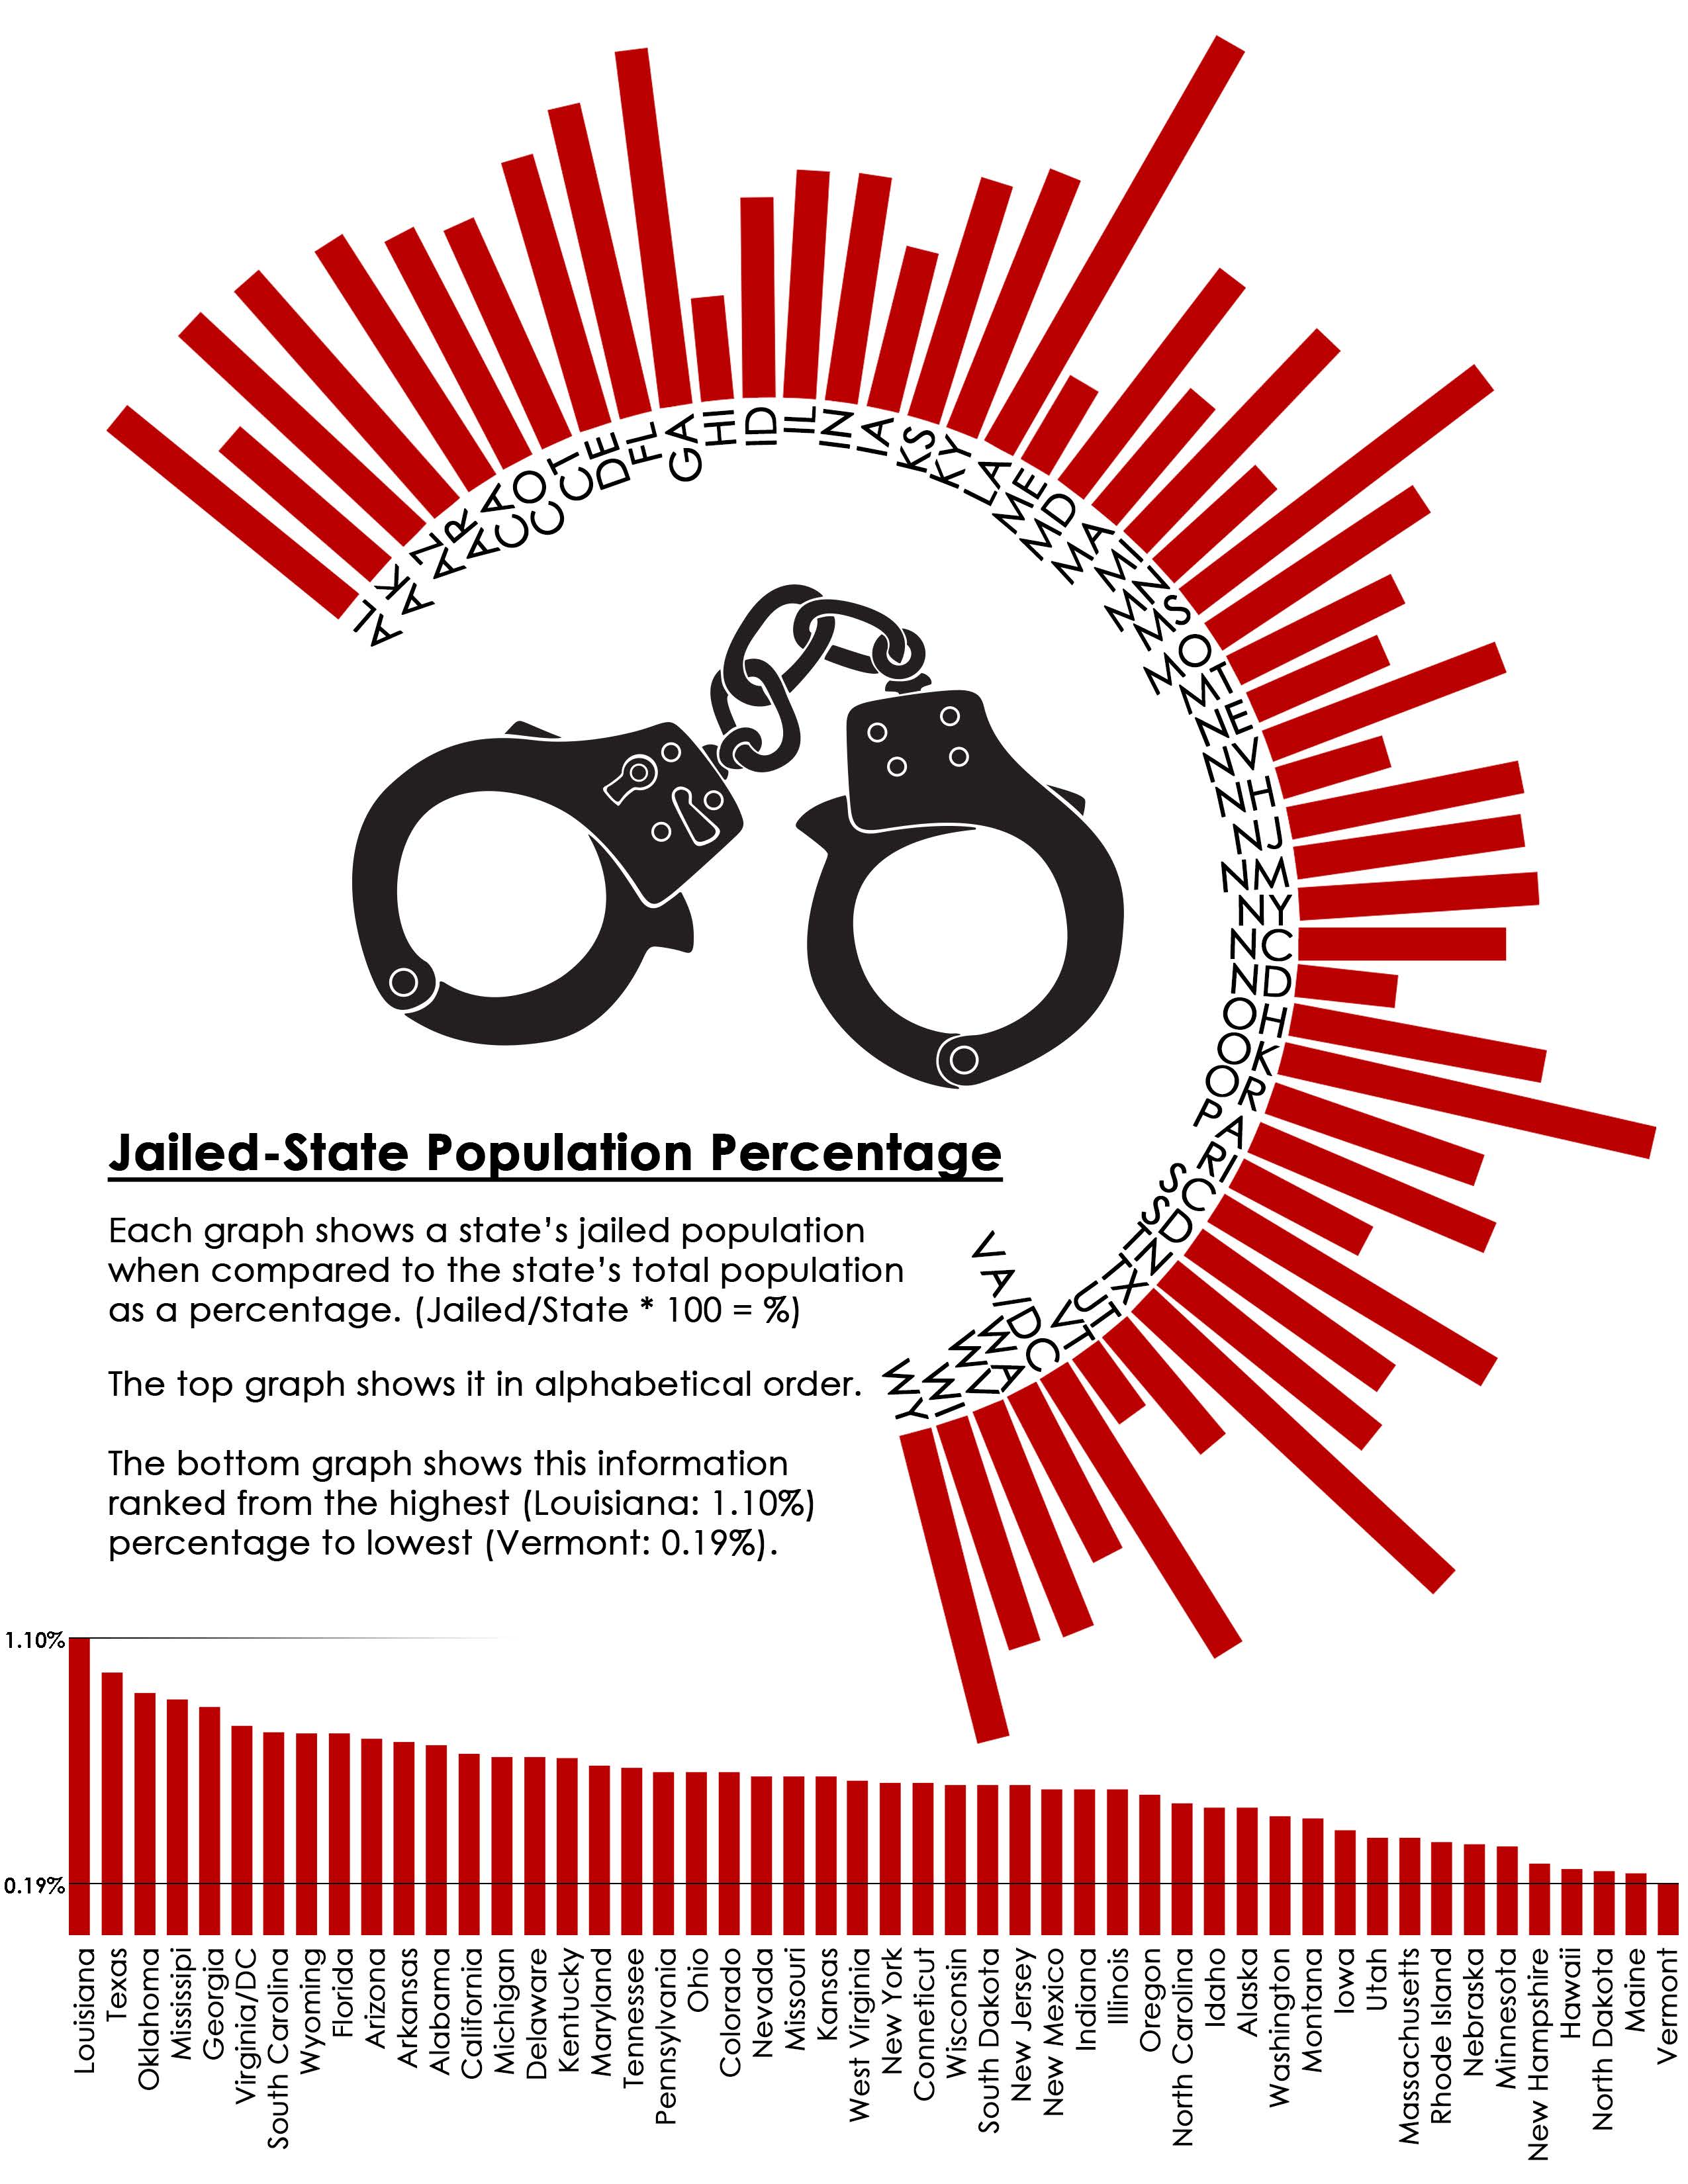
Jailed Population by State
This shows the percentage of total population per state that is in jail.
Non-White Distribution in the United States
This was done on a country, state and congressional district level to show the overall non-white distribution in the states due to the preconception that Americans are white.

